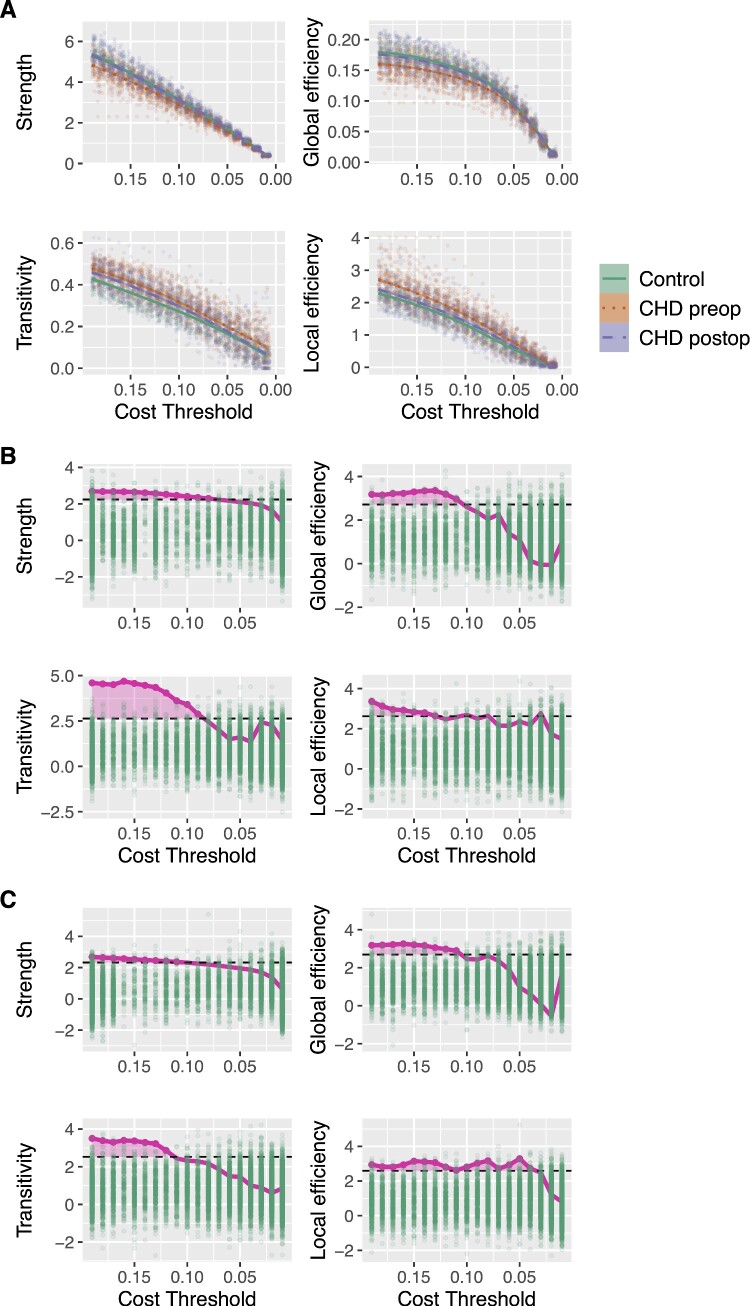
Figure 1.
(A) Global graph theory parameters in pre- and post-operative CHD neonates and controls across network cost threshold range. Individual observations at each threshold are plotted as scattered points in background. (B) Results from MTPC comparison of pre-operative CHD neonates and (C) of post-operative CHD neonates versus healthy controls. Comparison corrected for age at scan, MRI cohort and sex. Green dots correspond to maximum permuted test statistics across threshold (Acrit), dashed horizontal black line depicts significant test statistics threshold defined as the top αth percentile of the null statistics distribution (α = 0.025 for two one-sided hypothesis tests). Area in magenta indicates threshold cluster at which test statistics of observed group differences were above the critical test statistics threshold (Amtpc). Null hypotheses were rejected if Amtpc > Acrit. Here for global efficiency, transitivity and local efficiency. CHD, congenital heart disease; MTPC, multi-threshold permutation correction.

