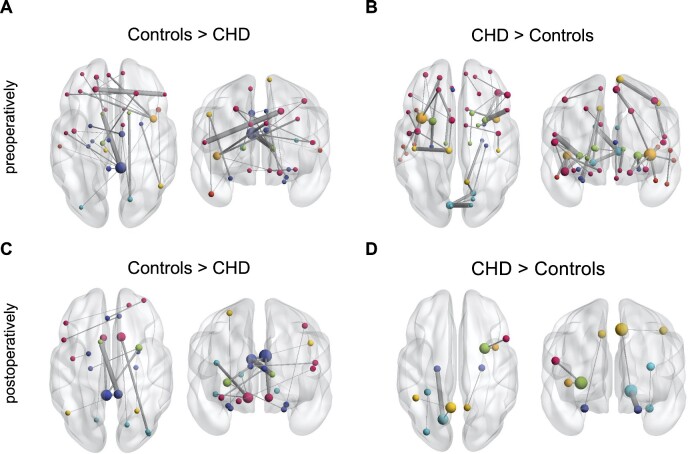
Figure 3.
Results of network-based statistic showing edgewise network differences between pre- (A,B) and post-operative CHD (C,D) neonates and healthy controls. (A) Connected components with higher connectivity strength in controls compared to pre-operative CHD neonates. (B) Components with higher connectivity strength in pre-operative CHD neonates compared to controls. (C) Network components with higher connectivity strength in controls compared to post-operative CHD neonates. (D) Components with higher connectivity strength in post-operative CHD neonates compared to controls. Network-based statistic was carried out at the cost threshold of 0.19. Comparison corrected for age at scan, MRI cohort and sex. Axial and coronal views of network components are shown. The left hemisphere is displayed on the left-hand side of the image. Nodal size corresponds to the nodal degree (number of connections), node colour corresponds to lobe membership (pink: frontal; orange: insula; dark blue: limbic; light blue: occipital; green: sub-cortical grey matter; yellow: parietal). Edge size corresponds to test statistics value. CHD, congenital heart disease.

