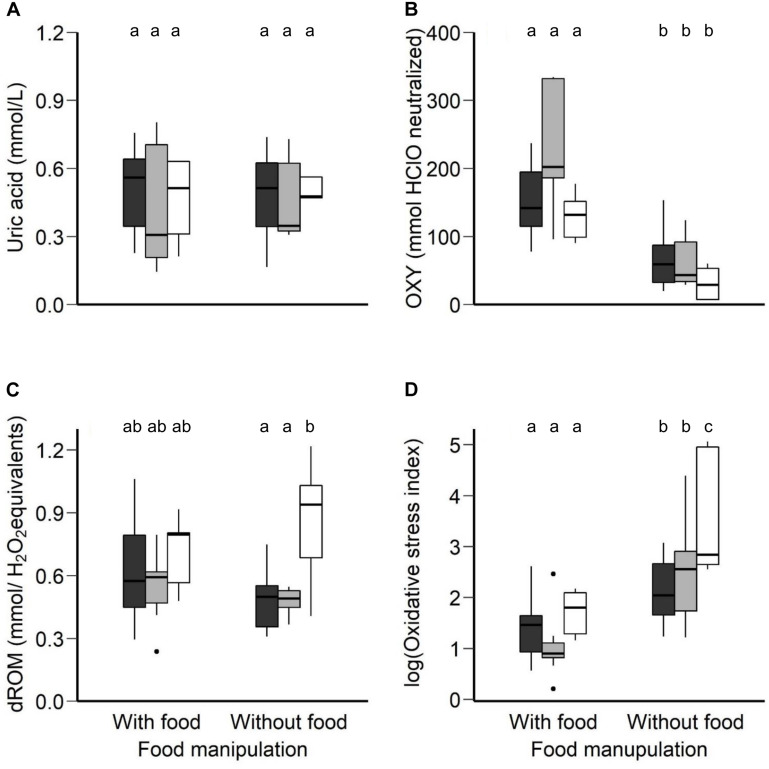
FIGURE 3.
(A) Uric acid (mmol/L), (B) OXY (mmol HClO neutralized), a metric for non-enzymatic antioxidant capacity, (C) dROM (mmol/H2O2 equivalents), a metric of oxidative damage, in plasma concentration and (D) oxidative stress index (log-transformed), calculated as the ratio of the oxidative damage to the total non-enzymatic antioxidant capacity in the plasma multiplied by 1000, in the morning following normal night-time body temperature with access to food and rest-phase hypothermia without access to food between the three age groups (young, middle-aged, old) of zebra finches. Boxplots show the median, the range and the inter-quartiles. Black boxplots represent the young group, light-gray the middle-aged group and the white the old group of birds. Different letters represent statistical differences after post-hoc Tukey’s comparison.

