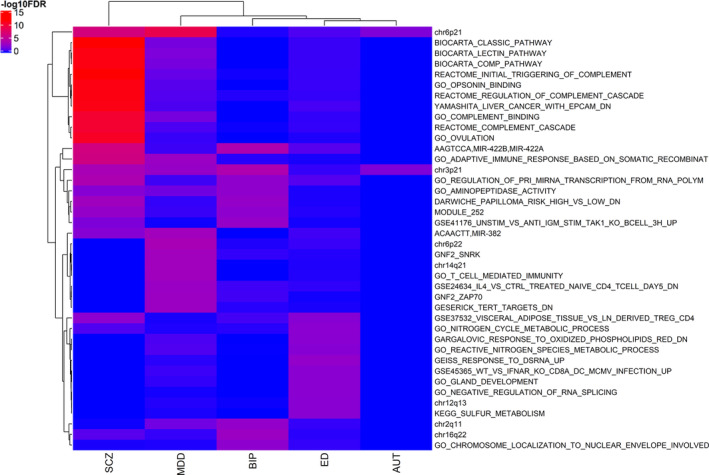
FIGURE 3.

Pathway signals heatmap (unconditional analysis) for the 10 top pathways from each trait. At the x‐axis are the hierarchical clustered Traits and at the y‐axis are the hierarchical clustered pathways according to the ‑log10FDR values [Color figure can be viewed at wileyonlinelibrary.com]
