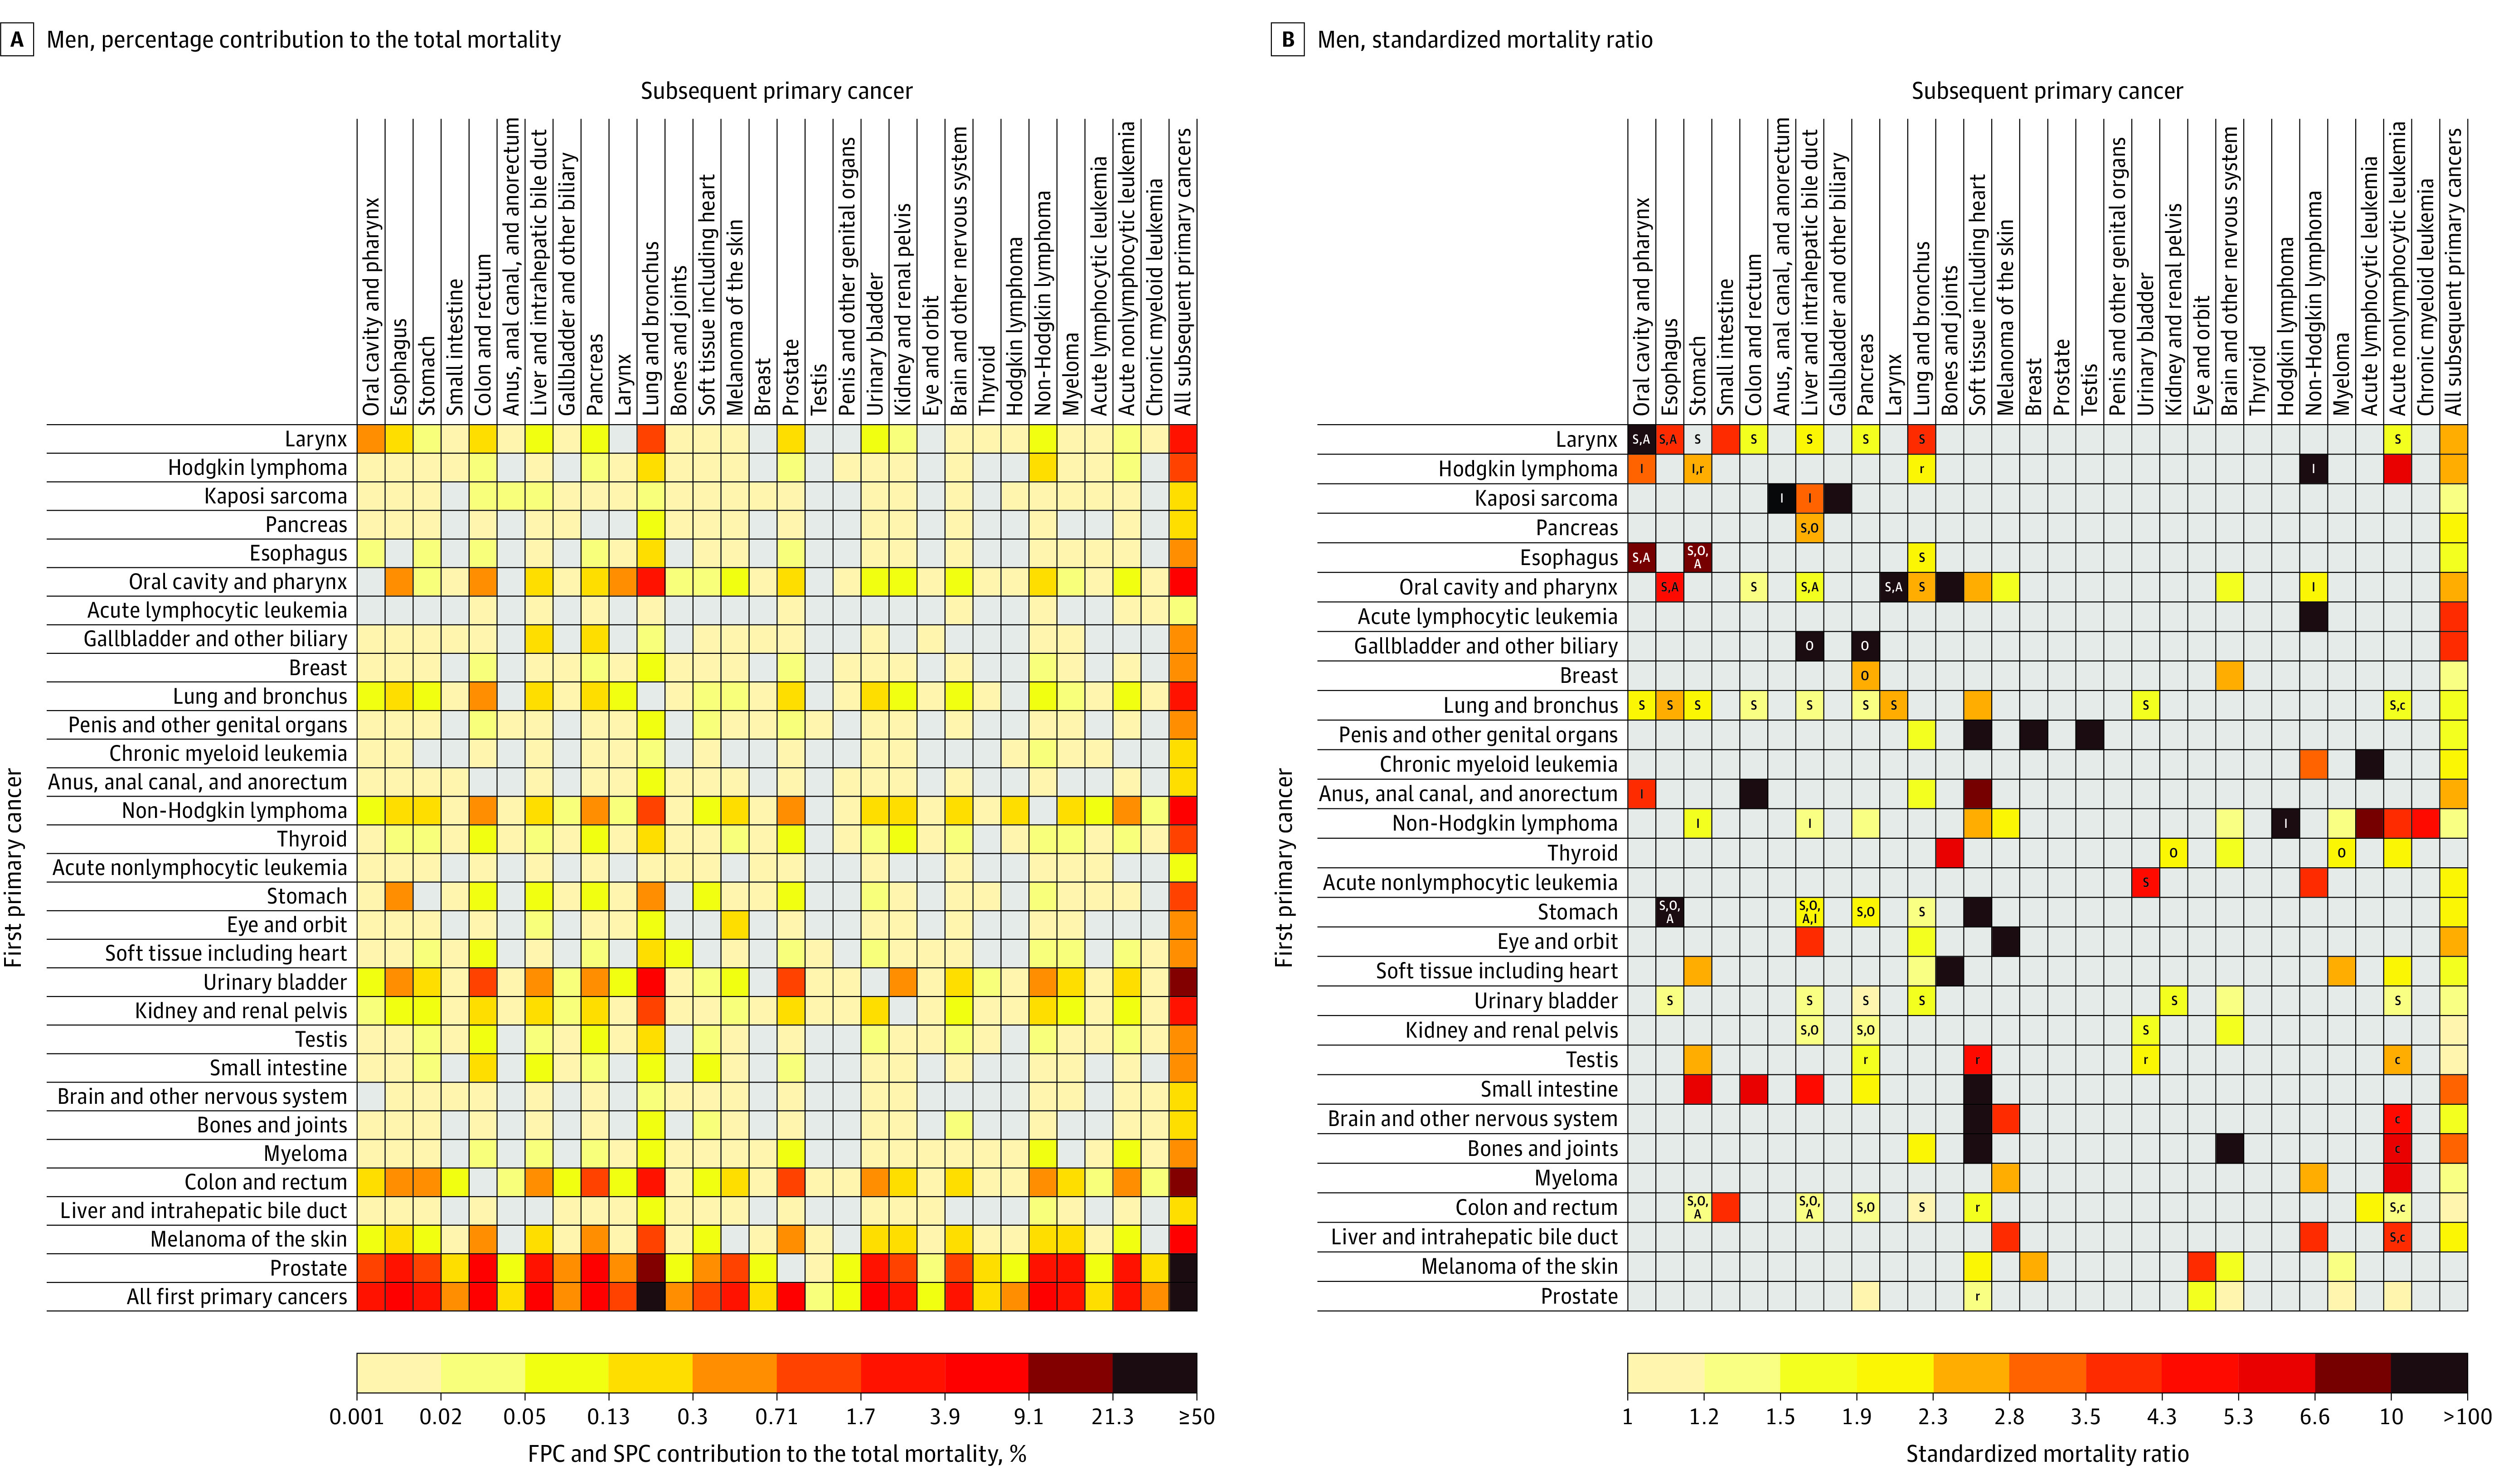
Figure 3. Risk of Dying From a Subsequent Primary Cancer Among 5-Year Male Cancer Survivors.

A, Calculated by dividing the observed number of SPC deaths of each cell by the total number of observed SPC deaths. B, Standardized mortality ratios (SMRs) were calculated as the ratio of the observed number of SPC deaths to the expected number of cancer deaths in the general population. Letters inside cells indicate major shared risk factors (A, alcohol-associated cancer18; I, infection-associated cancer19; O, obesity-associated cancer17; S, smoking-associated cancer16) or treatment-related SPCs (c, chemotherapy; r, radiotherapy)23,24,25,26 when there was a statistically significant association between the first primary cancer (FPC) and the SPC. Logarithmic color gradients indicate SIRs with statistically significantly higher than expected values based on eligible statistical tests (observed number of SPCs ≥5). Gray cells indicate statistically nonsignificant SIRs or associations not tested due to small number of observed SPCs. The risk of developing SPCs cannot be entirely attributable to risk factors annotated, and additional known and unknown factors may be in play. See Supplement 1 for point estimates and excess absolute incidences.
