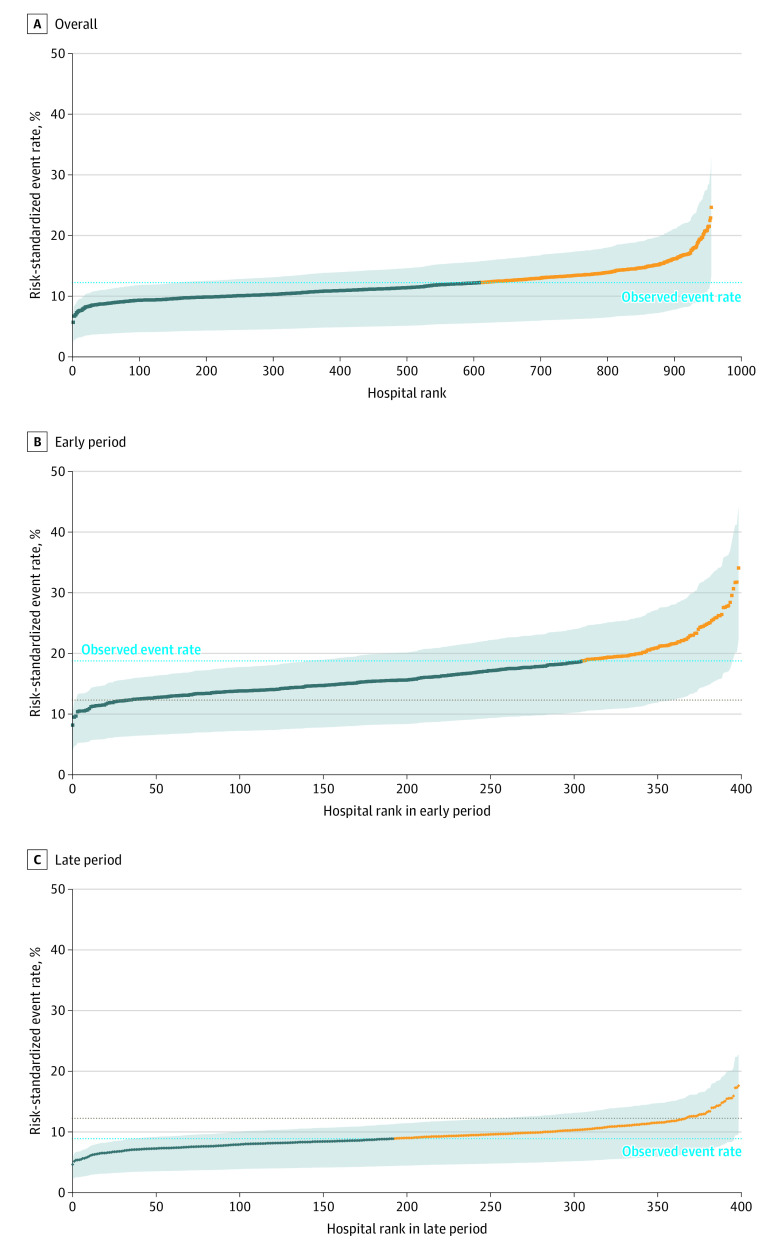
Figure 1. Hospital-Specific Risk-Standardized Event Rates for 30-Day Mortality or Referral to Hospice.
A, Risk-standardized event rates for all 955 hospitals and 38 517 patients. B, Risk-standardized event rates for 398 of these hospitals with patients admitted during the early period (January 1 to April 30, 2020 [gray dotted line indicates observed event rate during this period]). C, Substantially lower risk-standardized event rates for the same 398 hospitals (not necessarily in the same order) with patients admitted in the late period (May 1 to June 30, 2020 [gray dotted line indicates observed event rate during this period]). The blue dashed line representing the overall 2-period observed risk rate is the same in B and C to facilitate comparison. The dark blue dots represent the hospitals with a risk-standardized event rate below the overall observed rate, and the yellow dots represent those above. The gray shaded area indicates the interquartile range for the risk-standardized event estimate. A numerically higher rank corresponds to worse performance.

