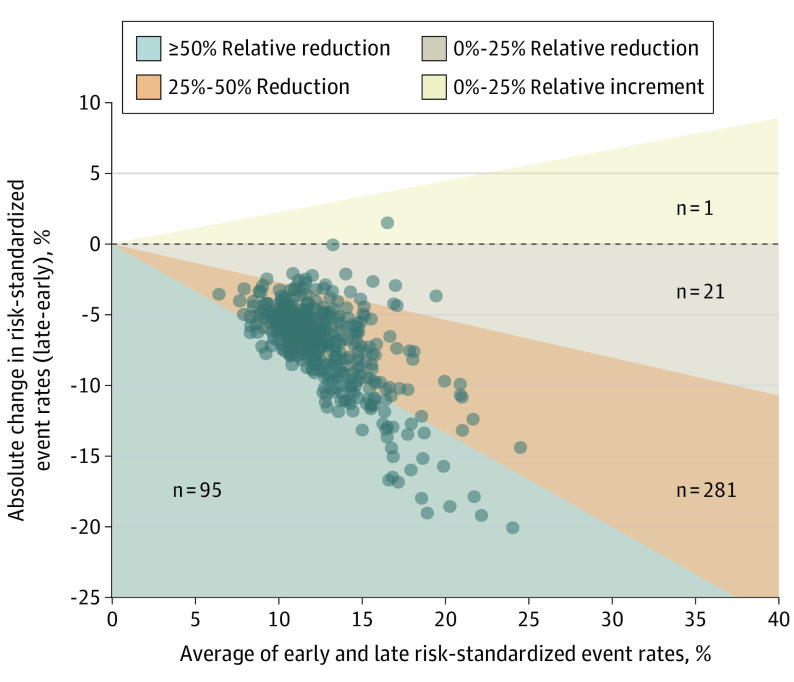
Figure 2. Two-Period Change in Hospital-Level Risk-Standardized Event Rates Between the Early and Late Periods.
Of 398 hospitals with at least 10 inpatients admitted with coronavirus disease 2019 (COVID-19) during each period, 397 improved their scores from the early period to the late period, shown by vertical distance below the horizontal dashed line in the Bland-Altman plot. The 95 hospitals in the grey region revealed at least a 50% reduction in event rate. The 281 hospitals in the orange region revealed a 25% to 50% reduction in event rate. The 21 hospitals in the beige region revealed a reduction of less than 25% in event rates. The single hospital in the yellow region revealed only a small increase in score. The general sloping of the scatter downward to the right suggests that hospitals with worse overall scores tended to show the most improvement.

