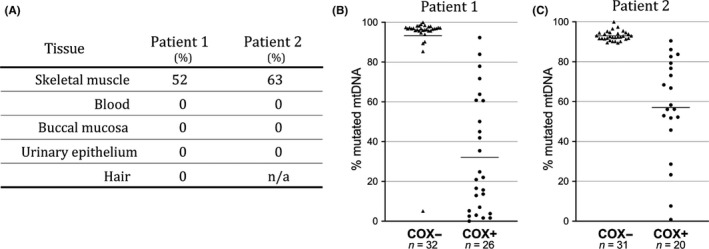
Figure 3.

Mitochondrial DNA mutation load. (A) Mutation load in different tissues: skeletal muscle, blood, buccal mucosa, urinary epithelial cells, and hair shows that the mutations are only found in skeletal muscle in both patients. n/a indicates data are not available. (B and C) Distribution of the mutation load measured in single COX‐normal (COX+) and COX‐deficient (COX−) muscle fibers. Horizontal bars represent the calculated means. The results from patient 1 (m.5669G>A) and patient 2 (m.5702delA) demonstrate that a high level of mutation load correlates with respiratory chain deficiency
