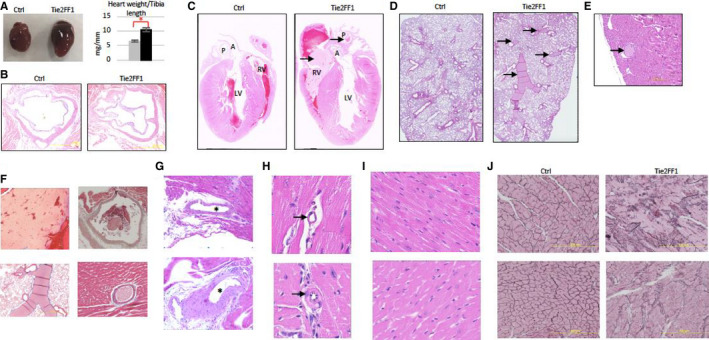
FIGURE 2.

The JAK2V617F‐positive Tie2FF1 mice have a prothrombotic and vasculopathy phenotype. A, Representative image of heart (left) and heart weight adjusted by tibia length (right) of 20‐ to 30‐week‐old Tie2 ctrl (gray) and Tie2FF1 (black) mice (n = 4–5 in each group). Statistical significance was determined by the Mann‐Whitney test. B, Representative hematoxylin/eosin (H&E)‐stained aortic root area of Tie2‐Cre ctrl and Tie2FF1 mice (magnification 4×). No significant atherosclerotic lesion was detected. C, Representative H&E staining of longitudinal sections of Tie2‐cre control and Tie2FF1 mice. Note the presence of thrombus (arrow) in right ventricle and main pulmonary artery of the Tie2FF1 mice. LV: left ventricle; RV: right ventricle; A: aortic root; P: main pulmonary artery (magnification 10×). D, Representative H&E staining of lung sections from Tie2‐cre control and Tie2FF1 mice. Note the presence of thrombus (arrow) in segment pulmonary arteries of the Tie2FF1 mice (magnification 10×). E, Representative H&E staining of coronary arteriole thrombus from the Tie2FF1 mice (magnification 10×). F, Representative Masson's trichrome staining demonstrates typical fibrin clot in right ventricle (upper left, 4×), pulmonary artery (upper right, 4×), segment pulmonary arteries (bottom left, 4×), and coronary arteriole (bottom right, 40×) of Tie2FF1 mice. G, Representative H&E staining of epicardial coronary arteries (stars) in Tie2‐cre control (top) and Tie2FF1 (bottom) mice. Note significant vascular wall thickening of the epicardial coronary artery in Tie2FF1 mice (magnification 4×). H, Representative H&E staining of intramyocardial coronary arterioles (arrow) in Tie2‐cre control (top) and Tie2FF1 (bottom) mice. Note stenotic lumen narrowing of the arteriole in Tie2FF1 mice (magnification 40×). I, Representative H&E‐stained cardiac sections taken from similar locations of the heart showing enlarged cardiomyocytes in Tie2FF1 mice (bottom) compared to control mice (top) (magnification 40×). J, Representative reticulin staining of cardiac sections taken from similar locations of the heart from control (left) and Tie2FF1 (right) mice are shown (magnification 20×). (For C–I: 5 control mice and 8 Tie2FF1 experiment mice were examined with similar findings; for J: n = 3 mice in each group were examined.) *P < .05
