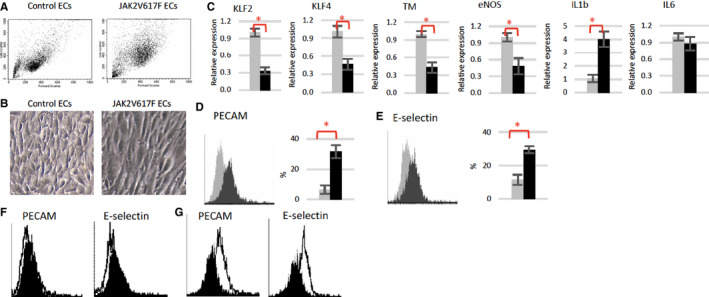
FIGURE 4.

JAK2V617F‐mutant quantitative polymerase chain reaction (ECs) display a pro‐adhesive and pro‐inflammatory phenotype. A, Representative flow cytometry dot plots of wild‐type and JAK2V617F‐mutant ECs. Note JAK2V617F ECs have higher forward scatter (ie, increased cell size) and side scatter (ie, increased granularity) compared to wild‐type (WT) ECs. B, Representative bright field images of wild‐type and JAK2V617F ECs (magnification: 10×). C, Gene expression levels in wild‐type (gray) and JAK2V617F (black) murine ECs were measured using real‐time quantitative polymerase chain reaction. Gene expression in VF ECs is shown as the fold change compared to WT EC expression, which was set as “1.” D and E, Representative flow cytometry histogram plots and quantitative analysis of platelet endothelial cell adhesion molecule (PECAM; D) and E‐selectin (E) expression in un‐sheared wild‐type (gray) and JAK2V617F‐mutant (black) ECs. F and G, Representative flow cytometry histogram plots of PECAM and E‐selectin expression in unsheared (black) vs sheared (white) wild‐type ECs (F) and JAK2V617F ECs (G). *P < .05
