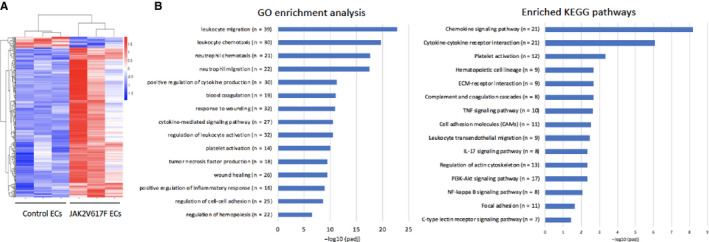
FIGURE 6.

Transcriptomic profiling of wild‐type and JAK2V617F‐mutant cardiac endothelial cells (ECs). A, Unsupervised hierarchical cluster heatmap of 234 differentially expressed genes between wild‐type and JAK2V617F ECs with an adjusted P‐value < 0.05. B, Differentially enriched Gene Ontology (GO) terms and Kyoto Encyclopedia of Genes and Genomes (KEGG) pathways in JAK2V617F‐mutant cardiac ECs compared to wild‐type control ECs. P values are plotted as the negative of their logarithm
