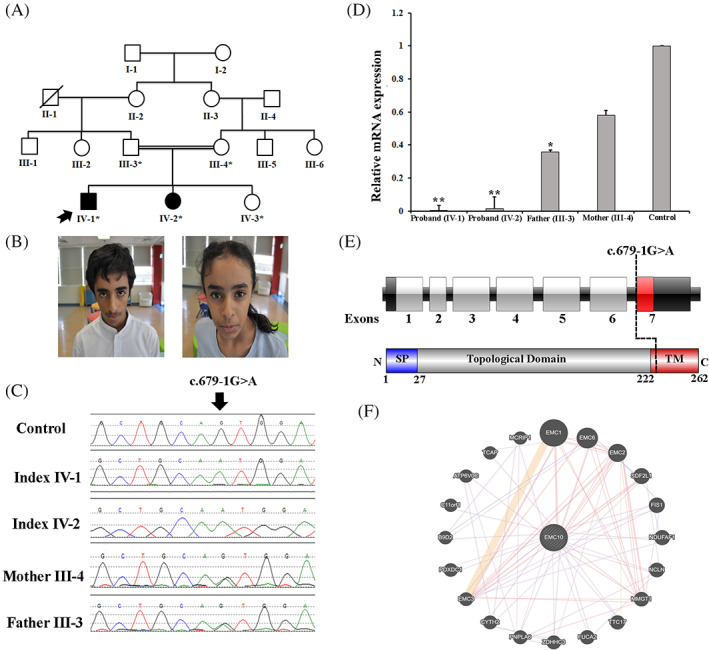
FIGURE 1.

A, Pedigree of the family showing consanguineous union and recessive inheritance pattern. B, Photographs of the affected individual (IV‐1 and IV‐2) exhibiting dysmorphic features, including a triangular face, broad forehead, plagiocephaly, and mild synophrys. C, Sanger sequencing electropherograms of the homozygous affected, heterozygous carriers, and a control sample. D, The EMC10 gene expression of the affected patients compared to the parents (carriers) and control. The results revealed that the affected individuals had decreased EMC10 gene expression. E, Schematic representation of the EMC10 gene with seven exons, the position of variant identified in the present study, and EMC10 protein with N‐terminal signal peptide (1‐27 aa), topological domain (28‐222 aa), and a C‐terminal transmembrane domain (222‐262 aa). F, Schematic representation of the EMC10 interactions with other proteins using GeneMANIA (https://genemania.org/) [Colour figure can be viewed at wileyonlinelibrary.com]
