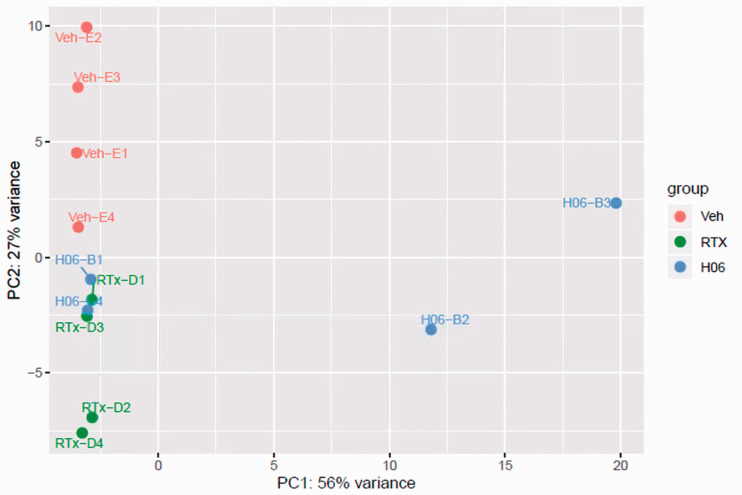
Figure 2.
Principal component analysis of resiniferatoxin- and IPSE-treated bladder gene expression. Principal component analysis showed homogeneous clustering of gene expression among resiniferatoxin-treated mice (green symbols labeled with “RTx-D”) and vehicle-treated mice (red symbols labeled with “Veh-E”). There was some overlap of gene expression among resiniferatoxin-treated mice and mice treated with both H06 H-IPSE and resiniferatoxin (blue symbols labeled with “H06-B”).

