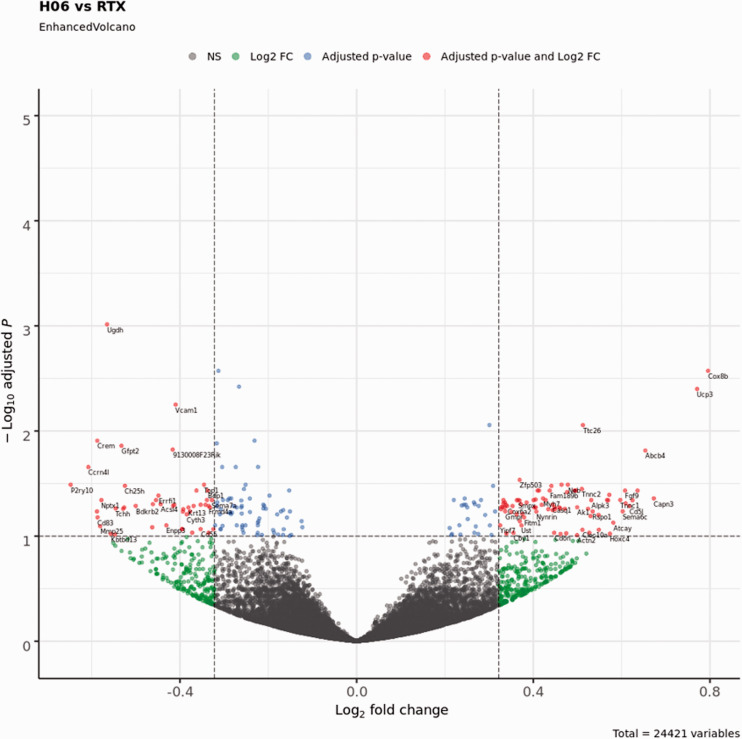
Figure 3.
Volcano plot showing differentially expressed genes between bladders treated with IPSE and resiniferatoxin (H06) versus bladders treated with resiniferatoxin alone (RTX). The cutoff value for the adjusted p-value was set at < 0.1, and the cutoff for the absolute value of the Log2 fold change was set at > 0.322 (1.25-fold in either direction). Blue dots represent genes satisfying the adjusted p-value cutoff. Green dots represent genes satisfying the Log2 fold change cutoff. Red dots represent genes satisfying both of these cutoff conditions and are labeled with the corresponding gene symbols. Gray dots represent genes that do not satisfy either condition (NS, not significant).

