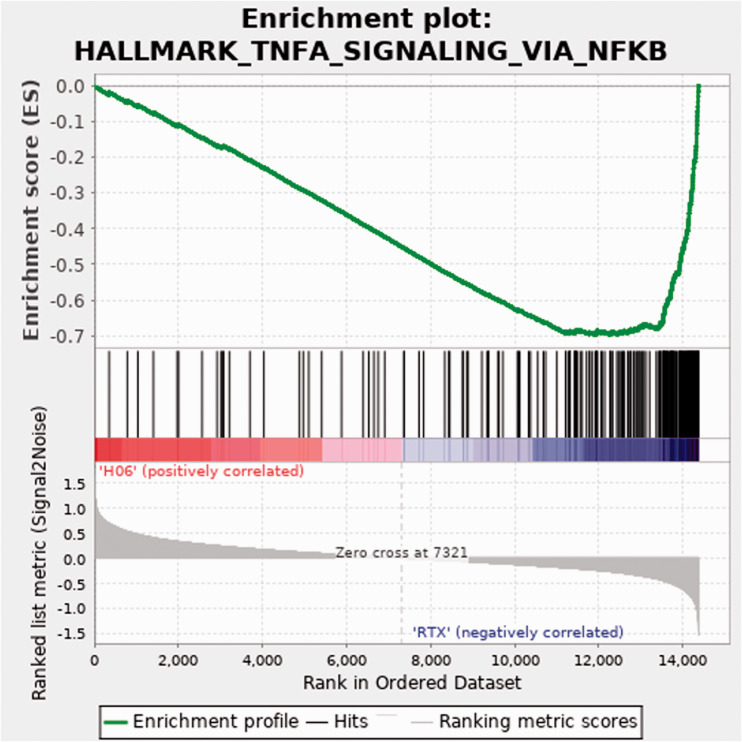
Figure 5.
Enrichment plot for the TNF signaling via NF-κB pathway. Top panel, green line indicates running enrichment score for the TNF signaling via NF-κB pathway as the gene set enrichment analysis walks down the ranked list of genes. Middle panel depicts where the members of the TNF signaling via NF-κB pathway gene set appear in the ranked list of genes. Bottom panel shows the value of the ranking metric moving down the list of ranked genes. Positive values indicate correlation with the first phenotype (H06; H-IPSE combined with resiniferatoxin) and negative values indicate correlation with the second phenotype (RTX; resiniferatoxin alone).

