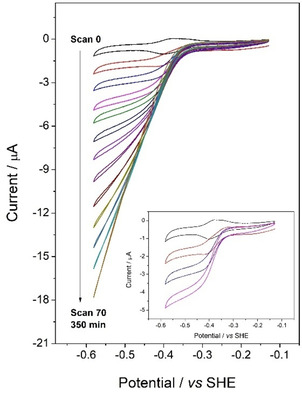
Figure 3.

Cyclic voltammograms recorded at different times following the injection of GLDH (to 8.7 nM final concentration) into cell containing 2‐oxoglutarate (20 mM), NH4Cl (30 mM) and NADP+ (20 μM) in 50 mM TAPS, pH 8.0, 25°C. The stationary ITO/graphite electrode introduced into the solution was preloaded with FNR to give a coverage of 0.2 nmol cm−2. The first cycle (scan 0, black trace) was recorded (scan rate 3 mV s−1) before injecting the aliquot of GLDH. The inset shows enlarged views of CVs recorded soon after GLDH injection.
