
FIGURE 7.
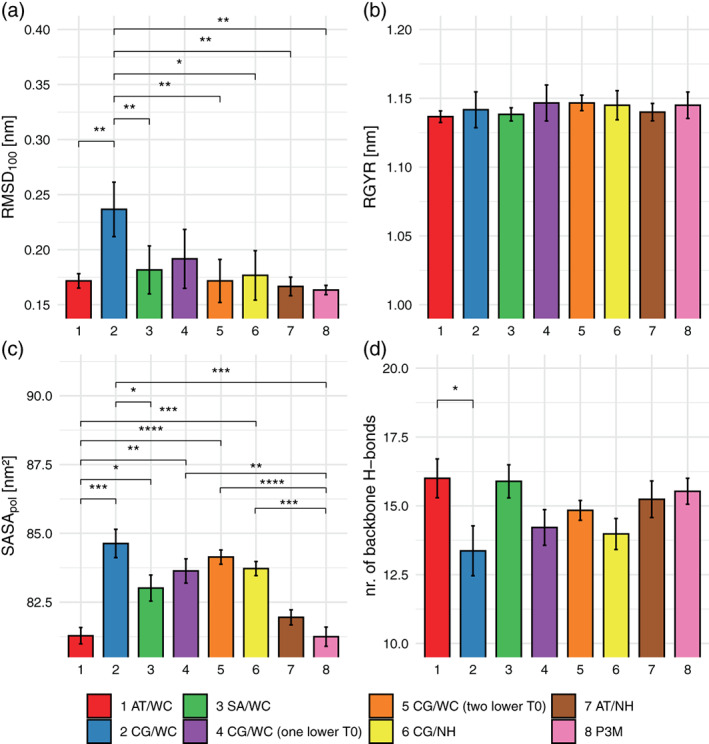
Simulations of Spitz EGF using seven different temperature settings (Table 3), with average RMSD100 in Panel (a), the radius of gyration in Panel (b), the SASApol in Panel (c), and the number of backbone hydrogen bonds in Panel (d) [Color figure can be viewed at wileyonlinelibrary.com]