Figure 7.

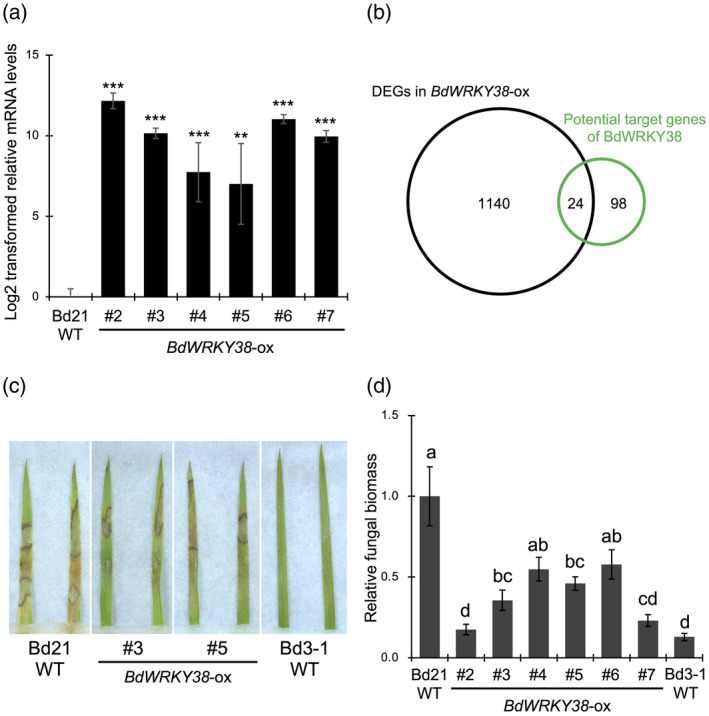
Transcriptional profiling and disease resistance to Rhizoctonia solani in BdWRKY38‐ox plants.
BdWRKY38‐ox (BdWRKY38‐overexpressing) plants were produced in a Brachipodium distachyon Bd21 background.
(a) Expression levels of BdWRKY38 were confirmed by quantitative reverse transcription polymerase chain reaction (qRT‐PCR) in BdWRKY38‐ox and wild‐type Bd21. Data are presented as means ± SEM of log2‐transformed expression values relative to wild‐type Bd21; **P < 0.01, ***P < 0.001, n = 4, using Student’s t‐tests. The BdUbi4 gene was used for normalization.
(b) Proportional Venn diagram showing the overlap in the potential target genes of BdWRKY38 inferred from the gene regulatory network (GRN) analysis and the genes differentially expressed in BdWRKY38‐ox plants.
(c) Lesion formation caused by R. solani on detached leaves at 3 days post inoculation (dpi).
(d) Relative biomass of R. solani in detached leaves at 3 dpi. Data are presented as means ± SEM of values relative to wild‐type Bd21. Different letters above the bars indicate significant differences at P < 0.05, n = 5, using Tukey’s test. These experiments were performed twice, with similar results using transgenic plants from the T1 generation, and representative results are shown.
