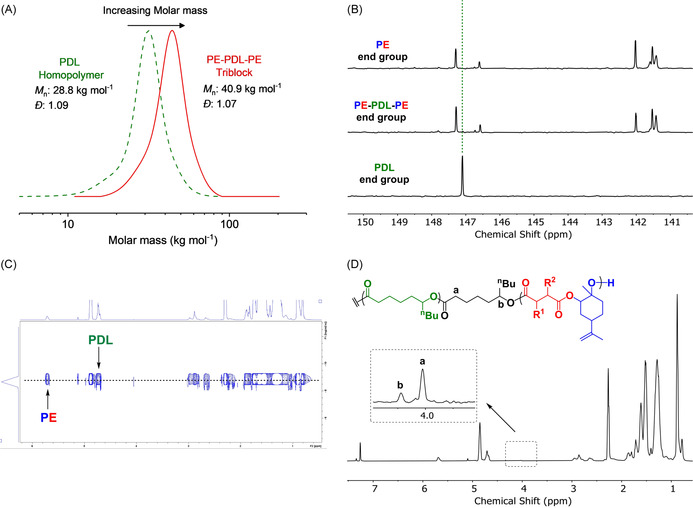
Figure 2.

Characterization data for P3 (Table 1): A) SEC traces showing increasing molar mass but retained narrow Đ (in THF at 30 °C, calibrated using polystyrene standards). B) Selected region of 31P{1H} NMR spectra of polymers, showing the evolving end group resonances as polymerizations progress. C) 1H DOSY NMR spectrum showing a single diffusion coefficient. D) 1H NMR spectrum illustrating polymer chain junction units (in CDCl3).
