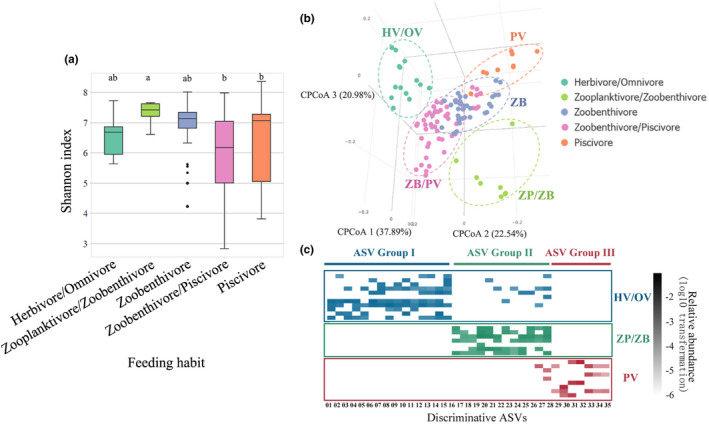
FIGURE 3.

The pattern of fish gut microbiomes shaped by feeding habit. (a) Box plots of Shannon index of the gut microbiomes in fishes among five different feeding habits. Kruskal‐Wallis test and Dunn's test (p < .05). The letters “a” and “b” represent Dunn's test grouping results. (b) Clustering pattern among all fish gut microbiome samples categorized according to the five feeding habits. Canonical correlation analysis was used, and distance was based on Bray‐Curtis distance. (c) Abundance heatmap of discriminative gut microbiomes detected among the three distinguishing fish feeding habits (p‐value < 0.01) [Colour figure can be viewed at wileyonlinelibrary.com]
