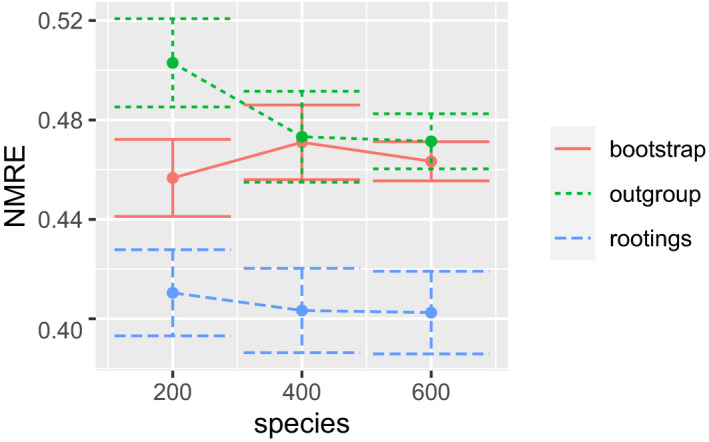
Figure 2.

NMRE (Equation 4) for several runs on simulated data sets where we only varied the total species count of the ‘true’ tree (the number of individual populations). Error bars denote the first standard deviation from the mean. Data were stratified by the three different operating modes of scrapp (see Section 2) [Colour figure can be viewed at wileyonlinelibrary.com]
