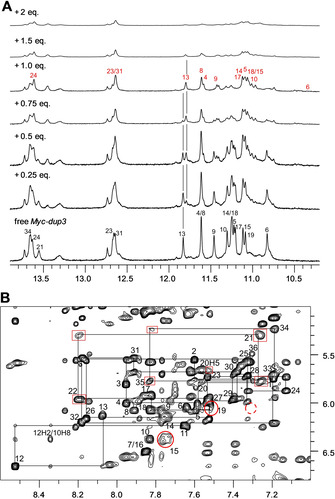
Figure 6.

NMR spectra of Myc‐dup3 (0.53 mm) at 20 °C. A) Imino proton spectral region upon addition of the PIQ ligand. Imino proton resonances are assigned to G residues in free Myc‐dup3 and in the ligand‐hybrid complex by black and red numbers, respectively. Vertical lines indicate the position of G13 H1 signals with their opposing change in intensity for free and complexed Myc‐dup3. B) H6/8(ω2)‐H1′(ω1) spectral region of a 2D NOESY spectrum (300 ms mixing time) in the presence of one equivalent of PIQ. A continuous walk by intranucleotide and sequential NOEs can be traced from G17 of the fourth G‐run of the quadruplex until the terminal G36 residue of the duplex. Crosspeaks broadened with respect to the free hybrid spectra are framed by red boxes and red circles for duplex and quadruplex protons, respectively. The dashed red circle indicates the position of a missing contact between residue G36 and G6 at the junction.
