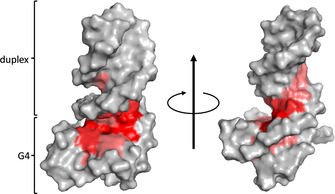
Figure 7.

Myc‐dup3 proton chemical shift perturbations after addition of 1 equivalent of PIQ mapped with red color of variable intensity on a surface model of the hybrid. View onto the 3′‐tetrad of the quadruplex–duplex junction (left) and rotation around the z‐axis with view into the duplex minor groove (right). For a more detailed compilation of chemical shift data see Figure S13 and Table S5 and S6.
