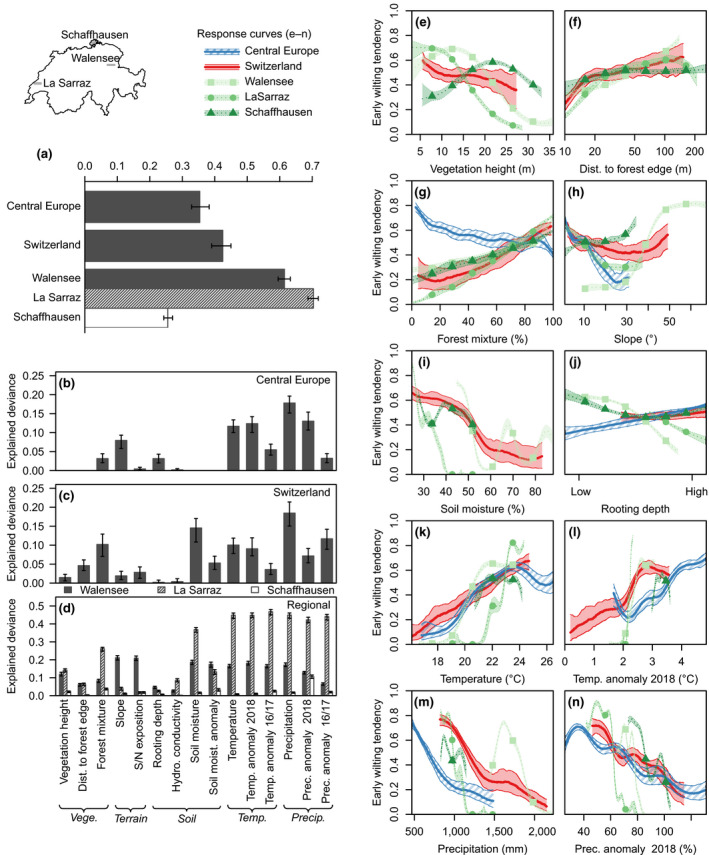
FIGURE 4.

Relationships between environmental drivers and early wilting. Panel (a) shows explained deviance of multivariate models considering full predictor sets (predictors with bars in panels b–d). (b)–(d), Deviance explained by univariate models for Central Europe (b), Switzerland (c), and focal regions (d), respectively. Bars indicate median values of 100 models fitted on resampled data; error bars indicate the 95% confidence intervals. (e)–(n), Univariate response curves representing different regions/scales. Central lines represent median estimates of 100 generalized additive models fitted on resampled data; polygons represent 95% confidence intervals. For distinction of regions/scales see legend on top center. Response curves of further predictors are shown in Figure S7
