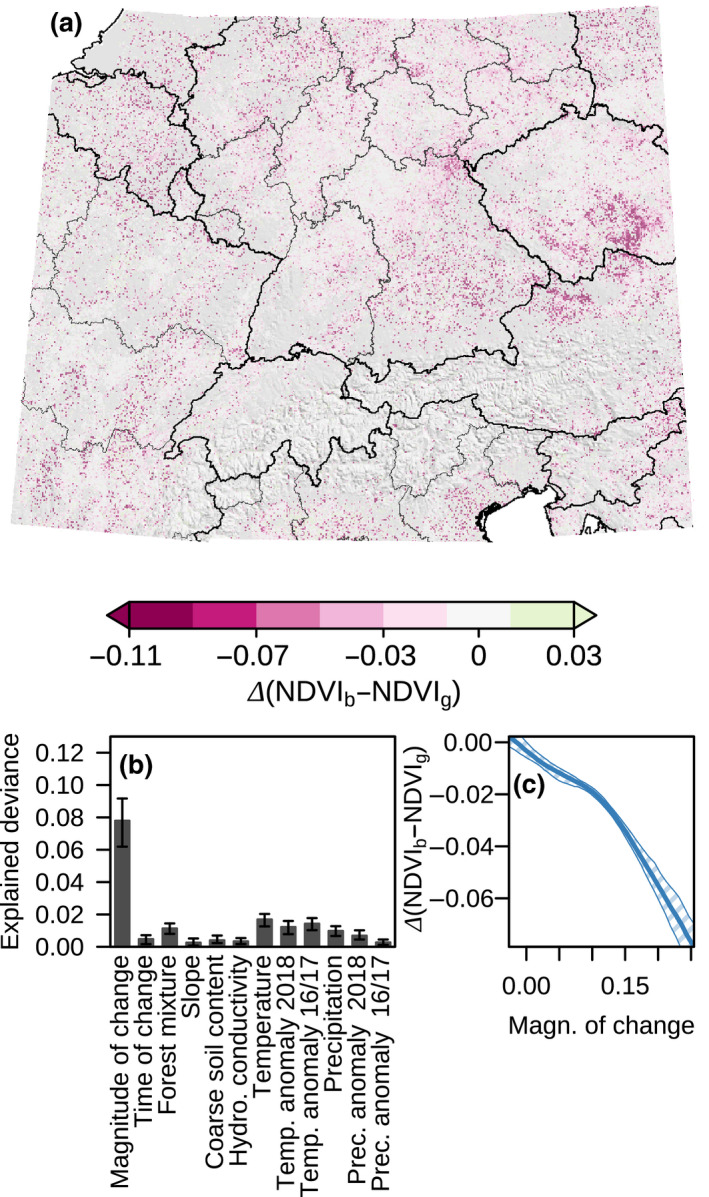
FIGURE 5.

Spatial patterns of following‐spring effect on greenness in early‐wilted forest. (a) Illustration of the 2018–2019 change in May/June Normalized Difference Vegetation Index (NDVI) differences between patches affected by early wilting (NDVIb) and non‐affected patches (NDVIg) at 500 m grain for Central Europe. (b) Explained deviance of univariate models of the 2018–2019 change in May/June NDVI differences. (c) Response curve of the 2018–2019 change in NDVI difference to the magnitude of NDVI change at the change point of the 2018 NDVI summer time‐series. Central line represents median estimates of 100 generalized additive models fitted on resampled data; polygon represents 95% confidence intervals
