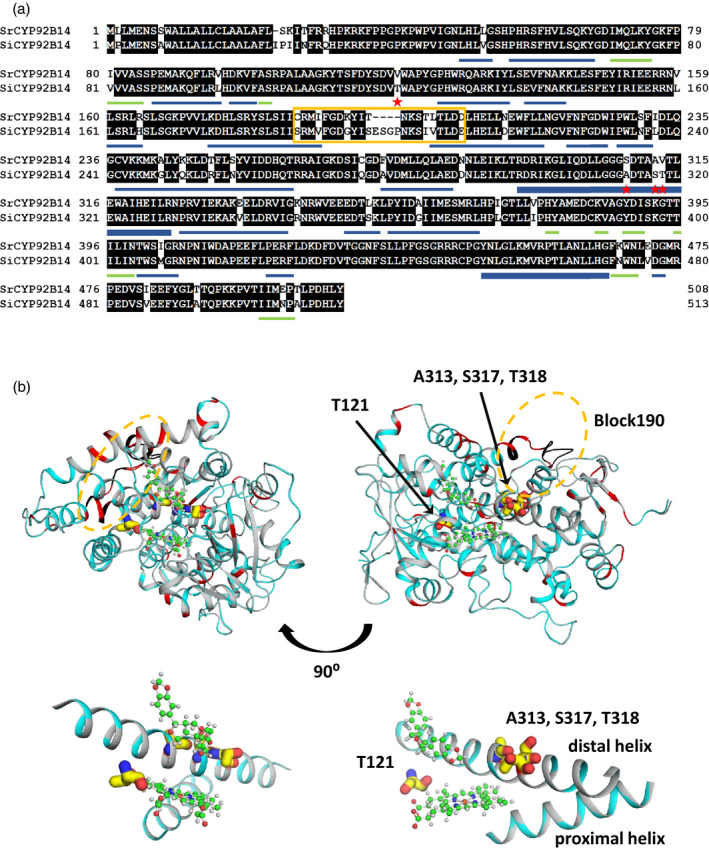
Figure 4.

Sequence and structural comparison of SrCYP92B14 and SiCYP92B14.
(a) Sequence comparison between SrCYP92B14 and SiCYP92B14 proteins. Sequences were aligned with GENETYX ver. 12. Red stars and yellow box depict the exchanged residues in SrCYP92B14 and SiCYP92B14 mutant proteins. The secondary structure of CYP92B14 was defined by DSSP programme (Kabsch and Sander, 1983). Helical (α, 310 and PI helices) and β sheet structures are represented by blue and green bars, respectively. The proximal and distal helices are represented by bold blue bars.
(b) Model structures of SrCYP92B14 and SiCYP92B14. The model structures were drawn by PyMOL
ver. 2.4.0a0. Ribbon model structures of SrCYP92B14 and SiCYP92B14 are represented in grey and cyan, respectively. Non‐conserved residues and exchanged regions are coloured in red and black, respectively. Heme and (+)‐sesamin are represented by ball and stick models. The substituted residues that were shown as red stars in (a) are represented by sticks. Partial enlargement view of the heme active site including (+)‐sesamin, proximal and distal helices; the substituted residues are shown at the bottom.
