Figure 4.

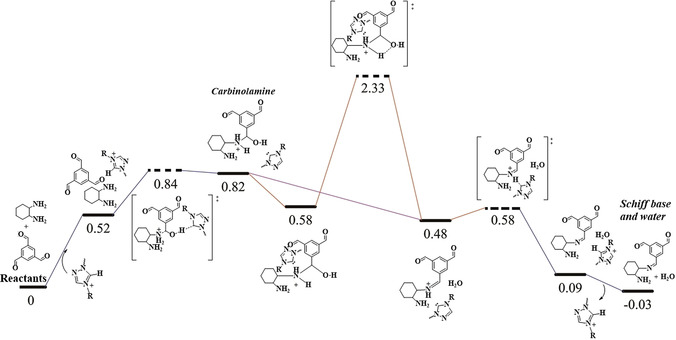
Energy profiles of the reaction path with catalyst (the 1,2,4‐triazolium monomer was used here for calculation). The horizontal dashed line represents the transition states, and the relative energies (ΔE) are noted above the line.

Energy profiles of the reaction path with catalyst (the 1,2,4‐triazolium monomer was used here for calculation). The horizontal dashed line represents the transition states, and the relative energies (ΔE) are noted above the line.