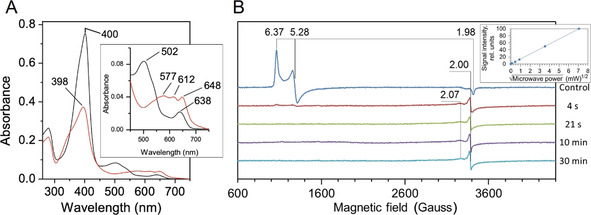
Figure 1.

A) Electronic absorption spectrum of FeIII‐DtpB (black) and compound I (red) generated by addition of one molar equivalent H2O2 (pH 5.0). Wavelength (nm) absorbance maxima are indicated. Inset: magnified Q‐band region. B) X‐band EPR spectra (10 K) of FeIII‐DtpB (control) and spectra of four samples frozen at variable times after addition of one molar equivalent H2O2. The principal g‐values in each spectrum are indicated with the zero field splitting rhombicity parameter E/D=0.023. Inset: dependence of the g=2 compound I signal on microwave power.
