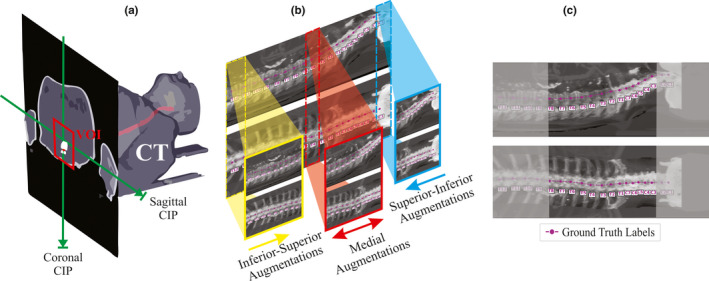
Fig. 2.

Visual depiction of IP image pair formation. (a) A 3D diagram depicting the formation of the coronal and sagittal intensity projection images across the VOI (red rectangle shows cross section of VOI) centered about the spinal canal (red). Maximum pixel values or mean pixel values are projected across orthogonal directions to obtain the MIP and AIP. (b) A depiction of how intensity projection pairs are augmented for training and for ablative testing. (c). An example of a central medial augmentation taken from the central region of an intensity projection pair (grey regions are removed) with ground truth annotations in magenta. [Color figure can be viewed at wileyonlinelibrary.com]
