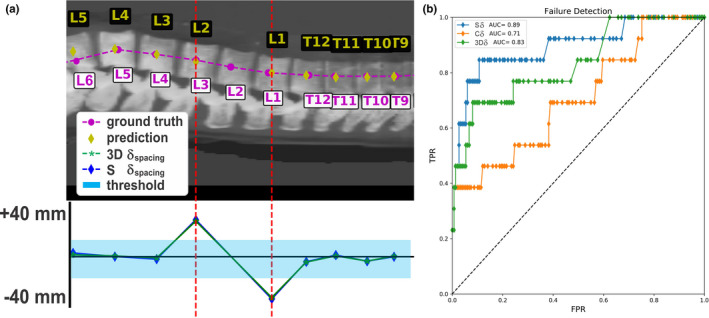
Fig. 6.

Optimization of the method to detect labeling failures. An example of a sagittal CIP prediction featuring a large rate of change in vertebral body spacing detection (a) and ROC curve (b). Blue, green, and orange plots are sagittal, 3D, and coronal δ plots, respectively. A large δ at L3‐L1 exists. This patient has an additional lumbar vertebrae (L6). The presence of a large gap between predicted lumbar centroids was observed when more than five lumbar exist. [Color figure can be viewed at wileyonlinelibrary.com]
