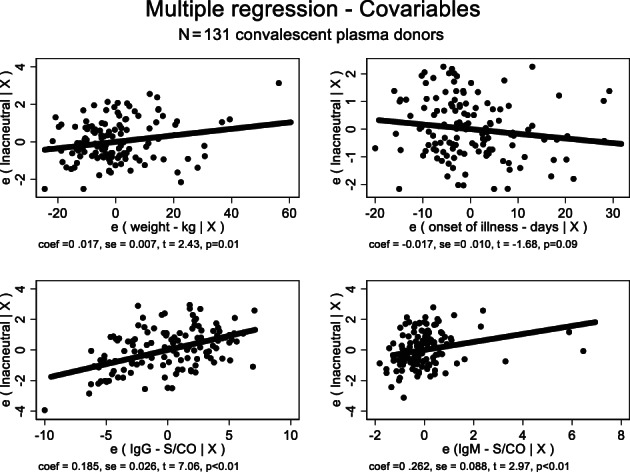
FIGURE 7.

Added variable plot derived from a stepwise multiple regression between neutralizing antibody titers (ln) and the key variables found to exert main dependence on neutralizing antibody: Weight (kg); time since onset of illness (days); IgG and IgM (S/CO). The y‐axis ‐ e (lnacneutral | X) ‐ shows the relationship between neutralizing antibody and each independent variable (x‐axis), adjusting for the effects of other remaining independent variables. 47 There is a mild, negative effect just for the onset of illness in days (P = .09). All the remaining independent variables are statistically significant. The model follows the equation: Y = 2.585 + 0.017b ‐ 0.017c + 0.185d + 0.262e, where Y = neutralizing antibody titer (ln); b = weight (kg); c = onset of illness (days); d = IgG S/CO; e = IgM S/CO
