
FIGURE 1.
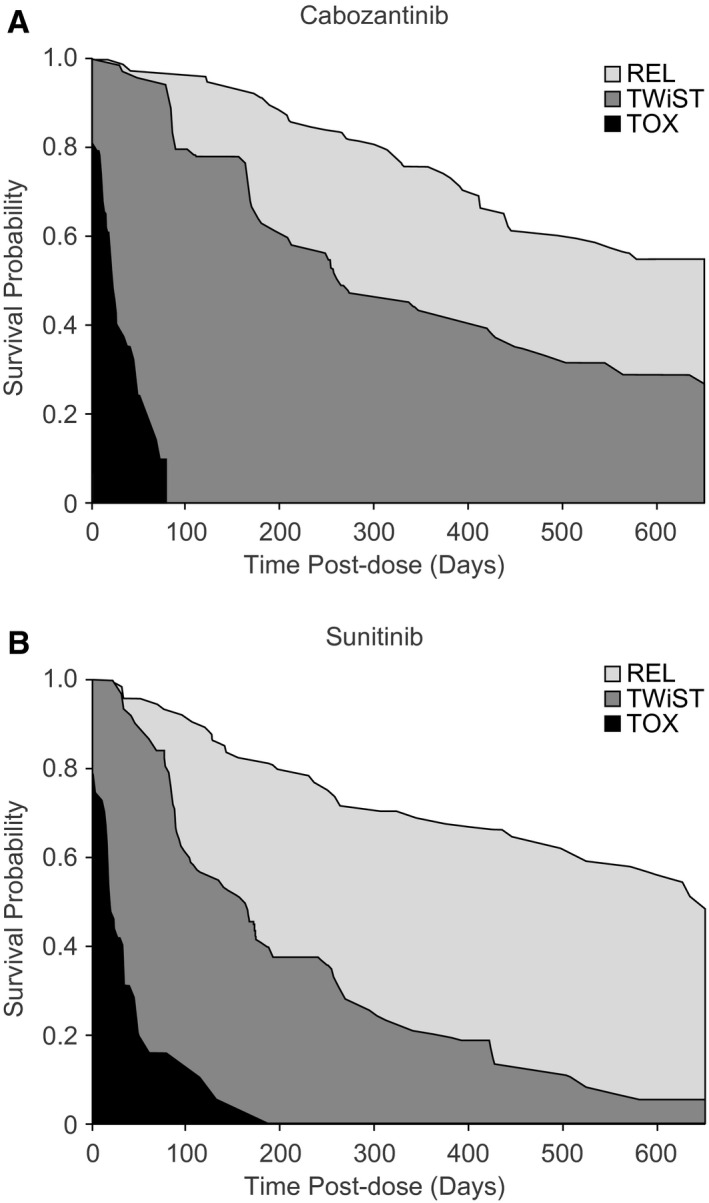
Partitioned Kaplan‐Meier survival curves representing the time spent in TWiST, TOX, and REL with (A) cabozantinib and (B) sunitinib. The areas between the curves correspond to the mean time spent in each health state (prior to utility weighting). Durations of adverse events are based on the A Study of Cabozantinib (XL184) vs Everolimus in Subjects With Metastatic Renal Cell Carcinoma (METEOR) trial 11 for patients treated with cabozantinib or the study by Patil et al 19 for the sunitinib group. REL indicates time after disease recurrence (relapse) or progression to death; TOX, time with toxicity before disease progression; TWiST, time without symptoms of disease and without toxicity.