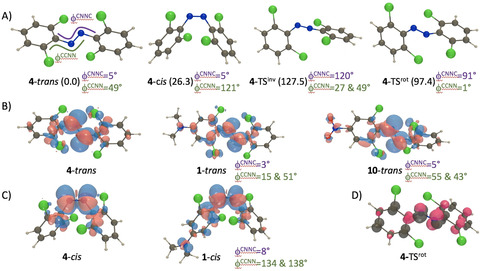
Figure 3.

A) Representation of the DFT optimal geometries for the two stable isomers as well as inversion and rotation transition states, together with relative free energies in parenthesis (in kJ mol−1) and key dihedral angles for 4; B) electron density difference plot for the lowest transitions in three selected trans compounds. The blue and red lobes indicate regions of decrease and increase of density upon excitation, respectively. Representation threshold 15×10−4 au; C) same for the cis isomers; D) spin density difference for the rotation transition state of 4 as given by BS‐DFT. Representation threshold 10×10−3 au.
