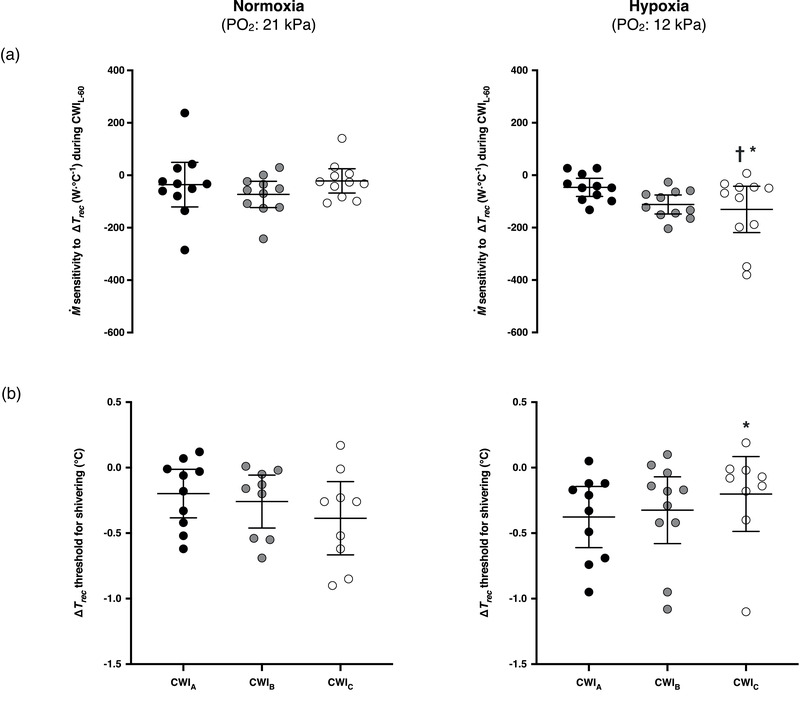
FIGURE 3.

Mean (95% CI) and individual values of the metabolic heat production () sensitivity (a) and shivering thresholds (b) obtained during the three successive cold‐water (20°C) immersions (CWIA: 1st trial, CWIB: 2nd trial, CWIC: 3rd trial) performed in normoxia and hypoxia. Number of subjects that exhibited a shivering response in normoxia: CWIA, 10; CWIB, 9; CWIC, 9; and in hypoxia: CWIA, 10; CWIB, 11; CWIC, 9. sensitivity was calculated for the last 60 min of each immersion (CWIL‐60). ΔT rec: changes in rectal temperature relative to baseline values. Significant difference † between CWIA and CWIC, and * between the normoxic and hypoxic CWIC
