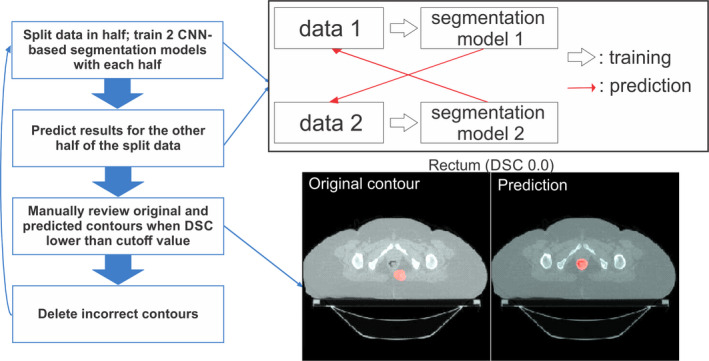
Fig. 3.

Flowchart of the semi‐automated data curation method to identify incorrect clinical contours. Data were randomly split into two groups, and two auto‐segmentation models were trained with each dataset. Then, each segmentation model was applied to the other group of data to create contours. If the Sørensen‐Dice similarity coefficient was lower than the threshold value, the original contour was manually reviewed and deleted if incorrect. [Color figure can be viewed at wileyonlinelibrary.com]
