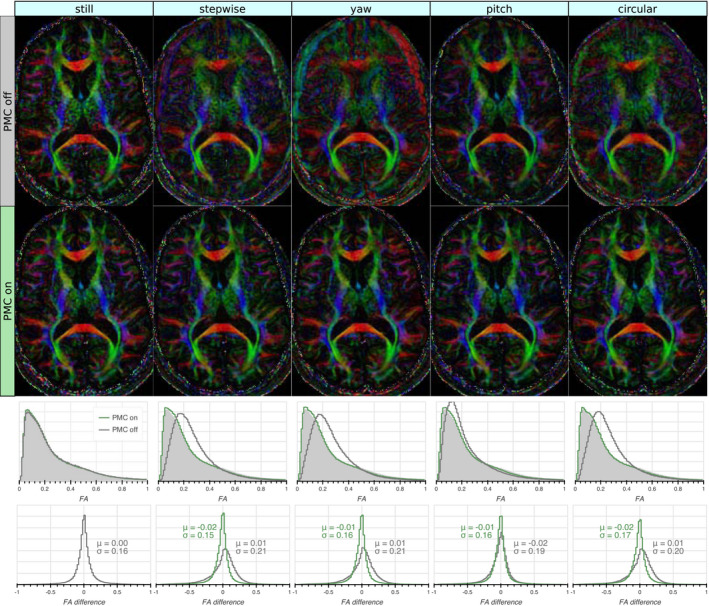
FIGURE 8.

Color Fractional Anisotropy maps calculated from the acquisitions with varying motion patterns (columns) without and with PMC (first and second row, respectively). The uncorrected motion corrupted the CFA maps, while the CFA maps from the prospectively corrected acquisitions agreed well with those acquired without motion. The third row shows whole‐volume Fractional Anisotropy (FA) histograms with and without PMC, with the reference (prospectively corrected without motion) shaded in light grey. The FA histograms with PMC on were in close agreement with the reference, while those with PMC off were shifted toward higher values. The bottom row shows whole‐volume histograms of the voxel‐wise FA difference to the reference with the mean (μ) and standard deviation (σ) indicated. The error distributions of the FAs with PMC on were very similar to those without motion and PMC off. The FAs acquired without PMC had broader error distributions that were skewed toward higher FAs, although their mean was close to zero
