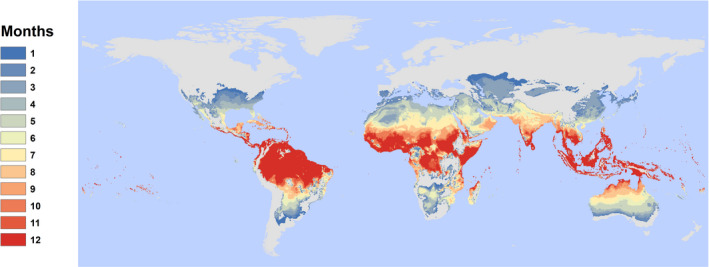
FIGURE 1.

Current distribution of temperature suitability for Zika transmission, by month. Results show the number of suitable months per year based on a 97.5% posterior probability for R0(T) > 0 based on the Tesla et al. (2018) model of Zika transmission, as a function of mean monthly temperature in each pixel
