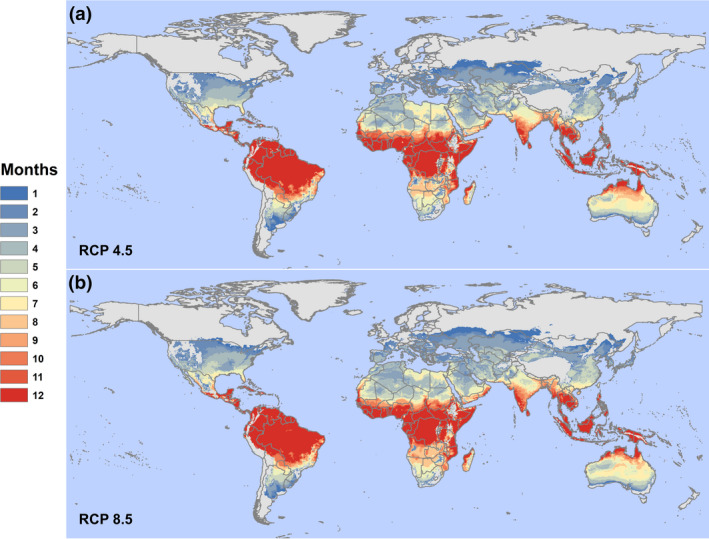
FIGURE 2.

A moderate‐case and worst‐case scenario for 2050. The figure shows our model projecting Zika transmission risk for (a) RCP 4.5 and (b) RCP 8.5 (HadGEM2‐ES). Results show the number of suitable months per year based on a 97.5% posterior probability for R0(T) > 0 based on the Tesla et al. (2018) model of Zika transmission, as a function of mean monthly temperature in each pixel. Country outlines are shown from the global administrative boundaries dataset (gadm.org), to facilitate visualizing differences between the scenarios [Colour figure can be viewed at wileyonlinelibrary.com]
