
FIGURE 1.
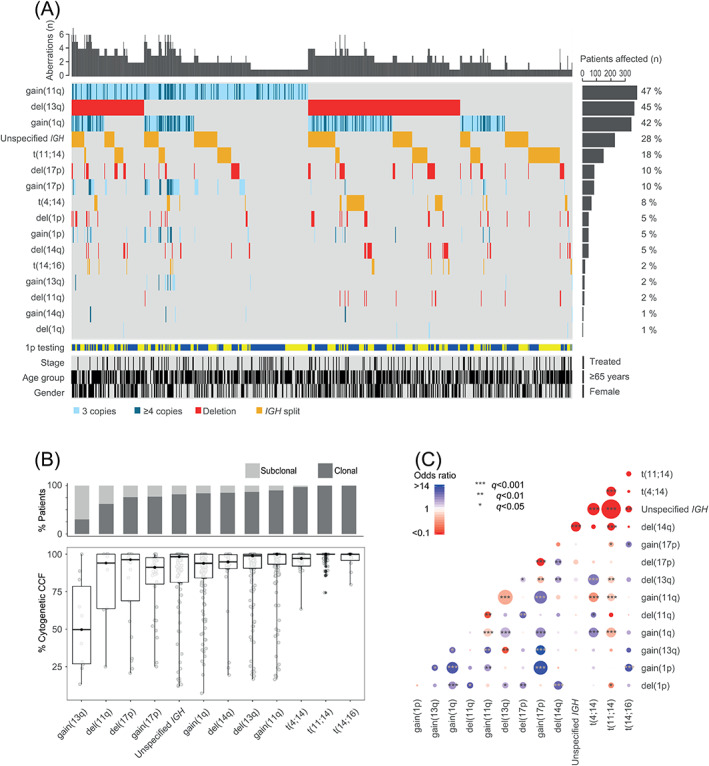
Cytogenetic landscape. (A) Co‐segregation of chromosomal abnormalities in 794 myeloma patients detected with FISH probes. Samples were annotated for 1p testing (1p36: blue, 1p32: yellow), stage (treated vs untreated), age group (≥65 years vs <65 years), and gender (female vs male); (B) Percentage of cases in which a cytogenetic aberration is found to be subclonal or clonal is shown across the patient samples subjected to CD138+ plasma cell enrichment (n = 344). Abnormalities with a frequency of ≥2% in the cohort are shown in the panel. The boxplot showing the cytogenetic cancer clonal fraction (CCF) of the chromosomal abnormalities shows the median (thick black horizontal line) and at the vertical extremities of the boxes the 25th and 75th percentiles. Whiskers' ends represent minimum and maximum values; (C) Pairwise associations between the cytogenetic aberrations present in ≥2% of 794 myeloma patients. Associations are defined with Fisher's exact test; blue color indicates a positive association, whereas red color indicates a negative association. Adjustment for multiple testing was done using the Benjamini‐Hochberg method and the size of the circle depicts the significance of the q value. Abnormalities of 1p (ie, gains or deletions) relate to either 1p36 or 1p32. Unspecified IGH indicates at least one unspecified IGH abnormality