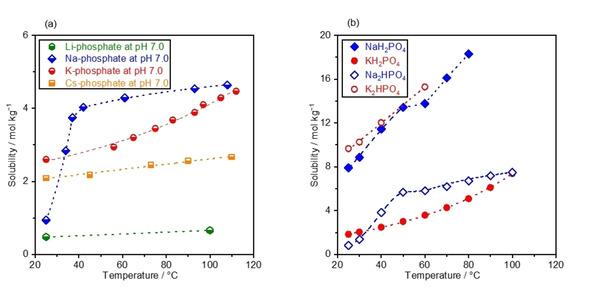
Figure 1.

Solubility curves of phosphate solutions. a) The solubility of M‐phosphate (M=Li, Na, K, Cs) was measured at various temperatures. b) The solubility of NaH2PO4, KH2PO4, Na2HPO4, and K2HPO4 was plotted as a function of the temperature, adopted from available dataset. [28] pH levels of solutions were adjusted to 7.0 at 25 °C prior to the measurements.
