
FIGURE 3.
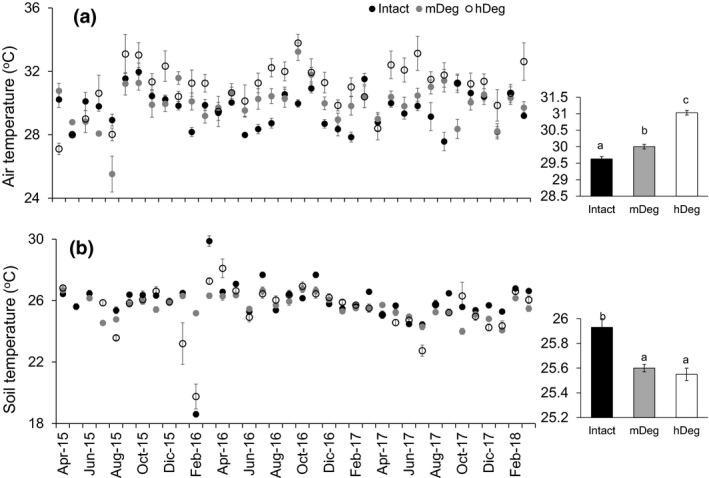
Monthly mean air (a) and soil (b) temperatures at the Intact, moderately (mDeg) and heavily (hDeg) degraded sites. Error bars are SE. Left charts display means per month (n = 18 at the Intact site, n = 36 at the degraded sites); right charts display 3‐year means (n = 648, 1,297 and 1,296, respectively at the Intact, mDeg and hDeg). Letters indicate significant differences in means between sites