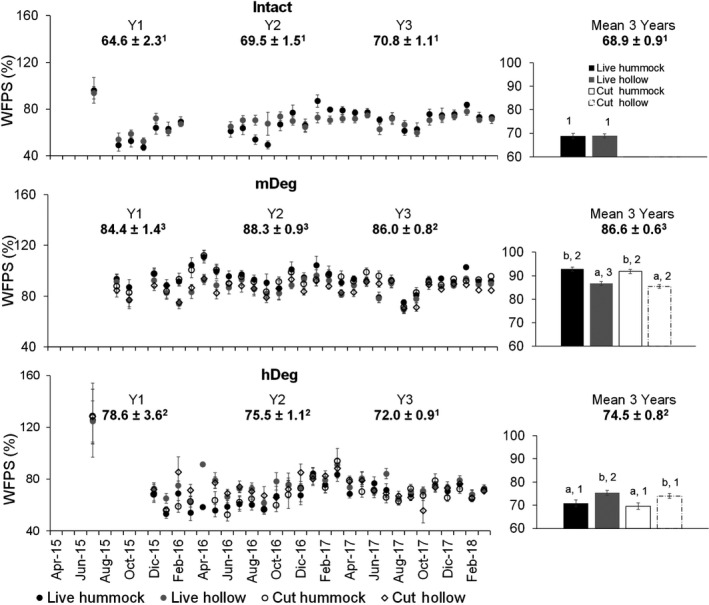
FIGURE 5.

Monthly and annual mean water‐filled pore space in hummocks and hollows around live and cut palms at the Intact, moderately (mDeg) and heavily (hDeg) degraded sites. Error bars are SE. Left charts displays means per month (n = 9 per palm status by spatial position at each site) and site‐scale annual means per year. Right charts display 3‐year means per palm status by spatial position (n = 241–260) and at site scale. Letters indicate significant differences in means between microtopographies within a site and palm status. Numbers indicate significant differences in means between sites
