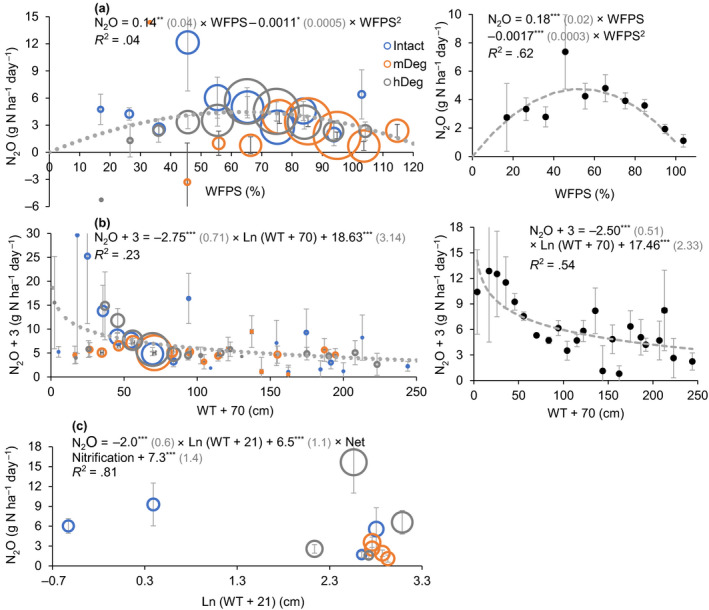
FIGURE 7.

Relationship between monthly average (a, b) or annual average (c) N2O emissions and the water‐filled pore space (WFPS), the water table level (WT) and net nitrification rate. (a, b) present monthly emissions averaged within the respective WFPS (10% interval) and WT (10 cm interval) classes, disaggregated by site in left charts and all sites combined in right charts. In (c), annual averages were disaggregated by microtopography per site (excludes year 1 when mineral N data were not monitored). Black dots or bubbles and bars present average values and SE; dashed gray lines show the models. The models are presented with coefficients (SE) and their level of significance (*p < .05, **p < .01, ***p < .001). The size of the bubbles is relative to the sample size in (a) and (b); it is relative to net nitrification rate in (c) (range −0.3 to 1.8 mg N kg−1 day−1)
