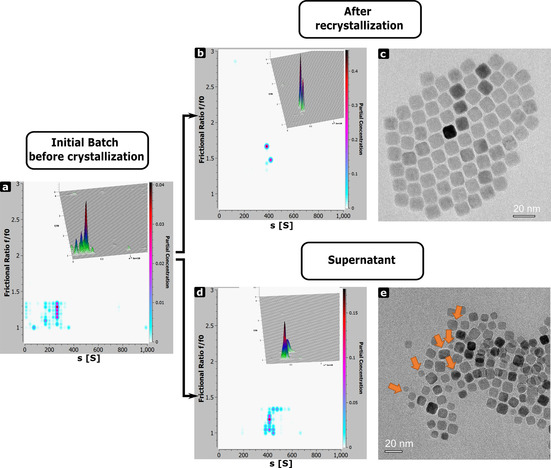
Figure 3.

Effect of recrystallization on shape selectivity of nanoparticles. a, b, d) 2D plots obtained by 2 DSA‐MC analysis of AUC data (Figure 2 d) showing the relation of sedimentation coefficient and f/f0 for the nanocrystals (batch I) before and after the crystallization of mesocrystals and supernatant. Insets top right show 3D representations of the plots, the colour gradient indicates the partial concentration of the species. c, e) Exemplary TEM images of the nanoparticle batch after the fifth recrystallization cycle and in supernatant. Orange arrows highlight several particles of non‐cubic shape. The analysis of the shape distribution is shown in Figure S8.
