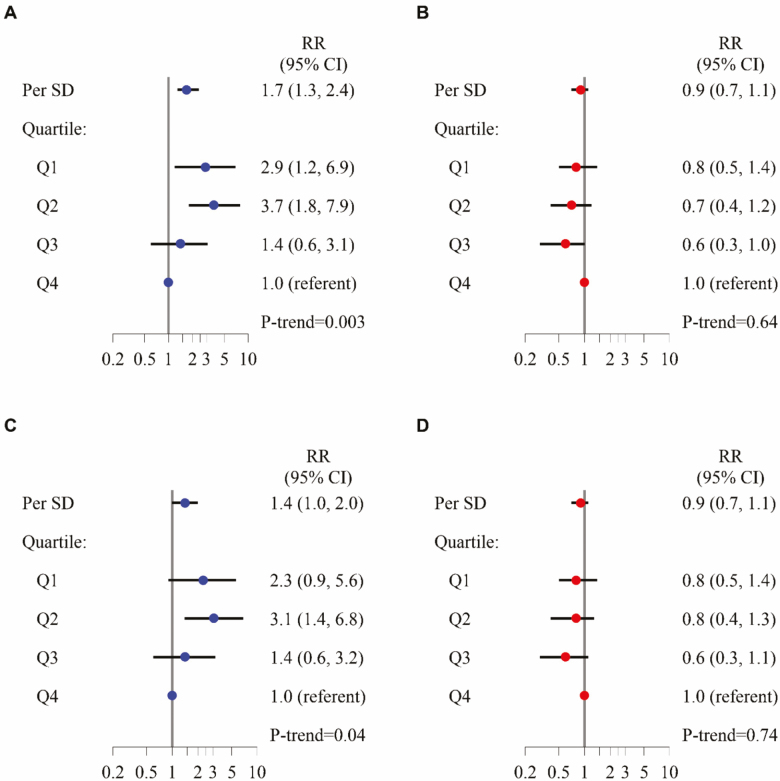
Figure 3.
Multivariable-adjusted relative risk for incident mobility disability, by quartiles and per SD increment of D3Cr muscle mass/wgt (A, C) or DXA appendicular lean mass(kg)/height (m2) (B, D). Multivariable models adjusted for age, race, clinical center, alcohol use, smoking status, comorbidities, physical activity, percent fat, exhaustion, cognitive function, self-reported health status and weight change. D3Cr muscle mass/wgt models also adjusted for height (A, B). Models further adjusted for strength and physical performance covariates also include chair stands, gait speed, and grip strength (C, D).

