
FIGURE 1.
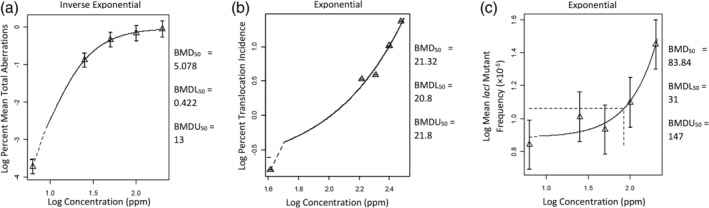
Examples of benchmark dose (BMD) analysis results adapted from PROAST outputs (see Appendix S1 for actual model output that provide greater details). Shown in the figure are the best‐fit models for the lowest permitted daily exposure (PDE) derivation for (a) chromosomal aberration (Donner et al. (2010) data set 6), (b) chromosomal mutation (Generoso et al. (1990) data set 4), and (c) gene mutations (Recio et al. (2004) data set 1). Name of the fitted model is shown above each figure. Triangle symbols and error bars are the geometic mean and confidence interval of the reported data. Solid curves are the modeled relationships between exposure and response. The controls are plotted at an arbitrary (but low) location on the log‐dose scale because log of zero is undefined; for that reason the model curve at the lower end is represented as a dashed line. Horizontal and vertical dashed lines indicate exposure associated with 50% response, but they may be difficult to see in (a) and (b) because they are very close to the axes. BMD50 is the 50% response benchmark dose central estimate, BMDL50 is the lower 95% confidence limit, and BMDU50 is the upper 95% confidence limit