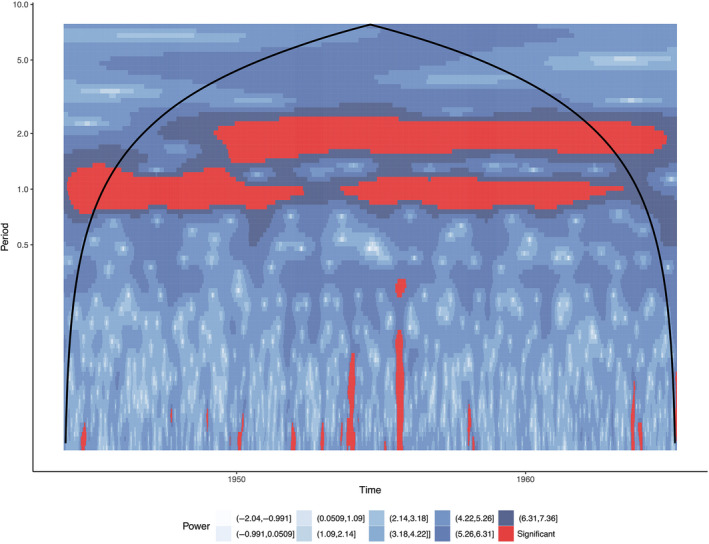
Figure 1.

Wavelet power spectra for London (1944–1994). Darker blues indicate more power, red areas indicate time/frequencies that were determined to be statistically significant by Monte Carlo methods. The parabolic line indicates the cone of influence, the boundary of points that may be affected by edge effect artifacts. Similar to spectral analysis, errors will occur at the beginning or the end of time series. Padding the data with zeros introduces discontinuities into the data, as we increase in scale, the amplitude is decreased as more zeros enter the analysis. For the regions outside the cone of influence, it is not clear if decreases in variance are due to the additional zeros
