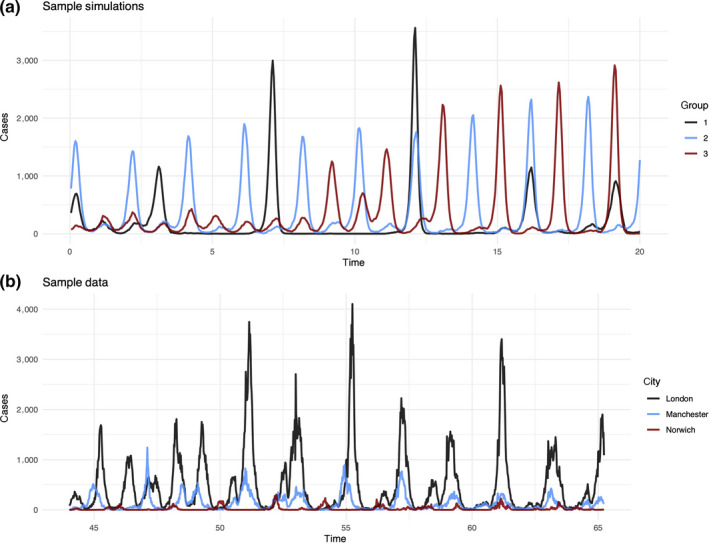
Figure 4.

Panel (a) shows a sample of simulations generated under different birth regimes. Group one is constant CBR of 0.015, group two is constant CBR of 0.03 and group three is CBR beginning at 0.012 and growing to 0.36. We see that group three begins with dynamics similar to those of group one; by the end of the 20‐year period, group three more closely resembles group two. Panel (b) shows case data from three cities of different cities and periodicities from the E&W data
