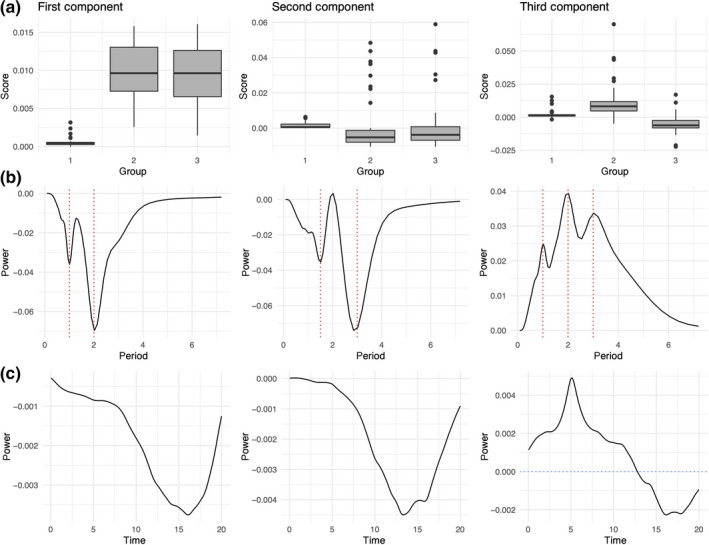
Figure 5.

Three‐rank tensor decomposition of the 150 simulated places. Panel (a) shows the distribution of scores on each of the three components for each of the three groups. Panel (b) shows the dominant periods explained by each component. Panel (c) shows the temporal trends for the periods depicted across panel (b). Each column gives a full description of each of the three components
