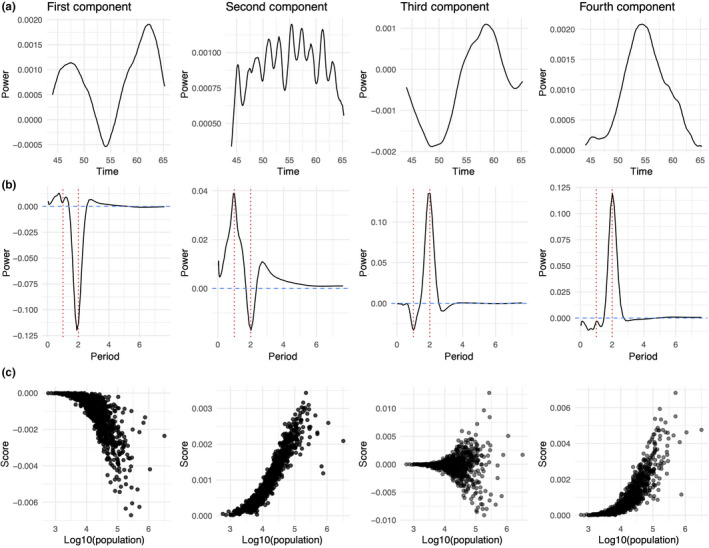
Figure 6.

The four components of the tensor decomposition for E&W urban districts. Panel (a) shows each of the time components, panel (b) shows each of the period components and panel (c) shows the distribution of scores on each component by population size. Each column corresponds to a single component (e.g. the first column represents the time, period and district‐specific scores for the first component of the decomposition). We see that small districts consistently score near zero on each component. This is consistent with previous work which suggests dynamics in small districts are highly irregular and lack the seasonal signature we see in large districts
